
Simply Wall St. is a sleek platform designed for tracking stocks and visualizing stock data. I always enjoy checking out and reviewing investing websites, but I am rarely as blown away as I was when I first checked out Simply Wall St.
As a FinTech start-up based out of Australia, Simply Wall St. has built a strong following of more than 3 million investors around the world and continues to grow quickly.
It clearly fits a need in the market where stock data is often boring to review and difficult to understand. I had the pleasure of meeting the Simply Wall St. team (a group of Millennials) at the 2015 FinCon conference in San Diego and then took a test drive of the platform.
Simply Wall St. Overview
For anyone who wants or needs to analyze stock data Simply Wall St. is an awesome place to start – it makes stock data accessible to any level of investor by turning an incredible amount of data into stunning interactive visuals and infographics.
The information on any stock is both valuable and easy to digest in a few minutes. I personally have always been a very visual person and I am pretty overwhelmed whenever I try to dig deeply into data about any particular stock – sure I do the research before buying, but I don’t really like doing it and I always feel like I am missing something.
Even though I don’t invest directly in many individual stocks, Simply Wall St. actually solved a lot of my own problems with stock research through their intuitive visualizations.
How Simply Wall St. Works
When logging in to the home screen users can start exploring and customizing the platform in a number of ways.
First, I recommend starting off by searching for any stock in the search bar. You can literally search for any stock you can think of on pretty much any exchange. I liked that the platform is so comprehensive – due in large part to the data which is provided by S&P Capital IQ.
As a tech guy, it’s pretty easy to see the long-term potential of the platform and Simply Wall St. will surely integrate more data APIs from other sources and continue to expand the available data on the platform over time. But in my own searching on the platform I didn’t find anything that was lacking – the data is incredibly rich and gives you a nice picture of the health of a company very quickly.
Another element that I liked on the user dashboard was the ability to search for stocks using pre-set filters including stocks that are “trending” and others that are believed to be “potentially undervalued” or have “high growth potential”. I spent a lot of time testing these buttons and they are awesome – it’s pretty easy to get lost in this rabbit hole, but it’s cool to see what other people are searching for and filter through stocks that might be a better ‘buy” than others.
There are also a bunch of other features on the homepage – including the ability to build a custom portfolio of stocks to watch and monitor over time. Also, any stock that you search for you can easily add to your custom portfolio to keep an eye on.
Now let’s take a deeper dive into the Simply Wall St. platform by looking at the information provided for individual stocks.
Simply Wall St. Stock Analysis Reports
Facebook was the first stock that I searched for on the platform.
Even though I am already very familiar with Facebook stock (I invested in the company’s IPO) I found the information presented to be incredibly valuable and actually learned a lot about Facebook stock that I didn’t know or hadn’t seen before.
Here’s how the individual stock analysis reports work.
Choose Your Mode
After arriving on the Facebook stock profile below I was given the option to select “beginner mode” (which I selected) on the right sidebar under options.
This is definitely a useful feature for new users since it allows you to learn more about how each section of the stock’s profile is constructed and what it means for you as an investor.
Even though most of the information on the platform is easy to understand, I strongly recommend new users make sure they use the platform in “beginner mode” at first.
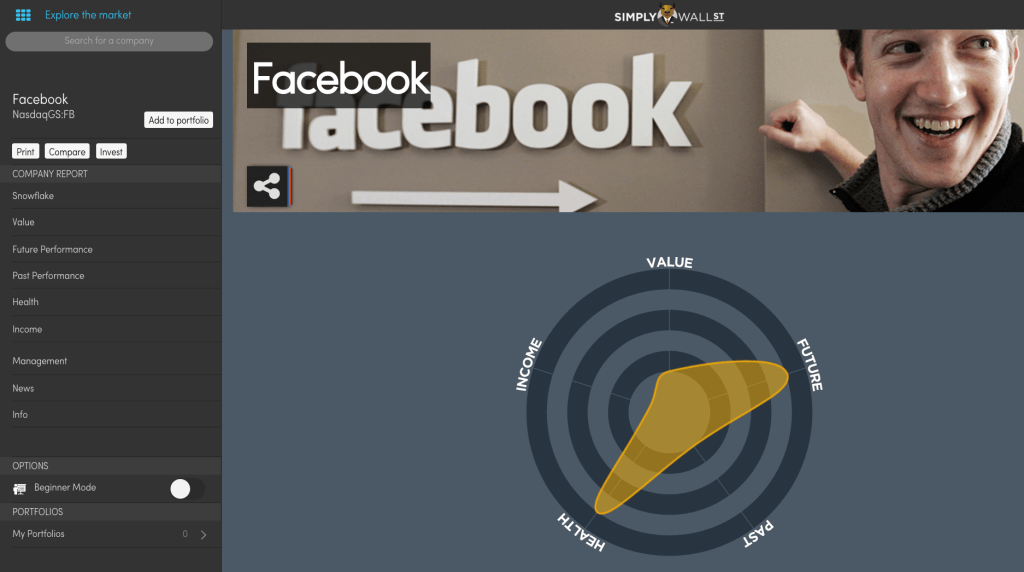
When you land on a stock’s profile the first thing that you see is an odd-looking shape developed by Simply Wall St. called the “snowflake” – which uses 30 different data points to paint a snapshot of a company’s health, past performance, earnings, value, and future potential performance.
When using the platform I found the “snowflake” pretty intuitive (takes about 5 minutes to get the hang of reading it) and a nice way to quickly assess the potential of any stock. To learn more about the Simply Wall St. “snowflake” and what is shows check out this video:
Competitors View
Another valuable feature is the competitor’s view – which shows other companies similar to Facebook.
This snapshot compares the “snowflakes” of each company so you can get a sense for the health and potential of the stock you are analyzing against its competitors.
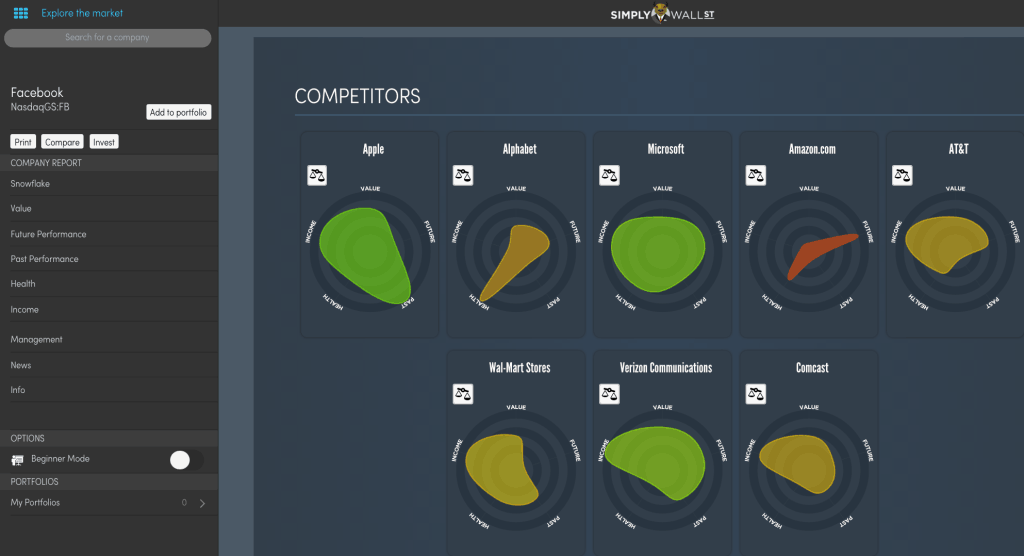
Notice how green Apple and Microsoft are below – when compared to the yellow of Facebook above. This quick competitor snapshot shows you that Apple and Microsoft are likely better “buys” than Facebook based on Simply Wall St. data.
Current Value
Next, when analyzing Facebook I found the data that showed the current value of the stock based on future cash flow to be particularly compelling.
Whenever you are looking into investing in a stock it is always a good idea to first understand whether the stock is over-valued or under-valued and I found Simply Wall St. to be especially helpful.
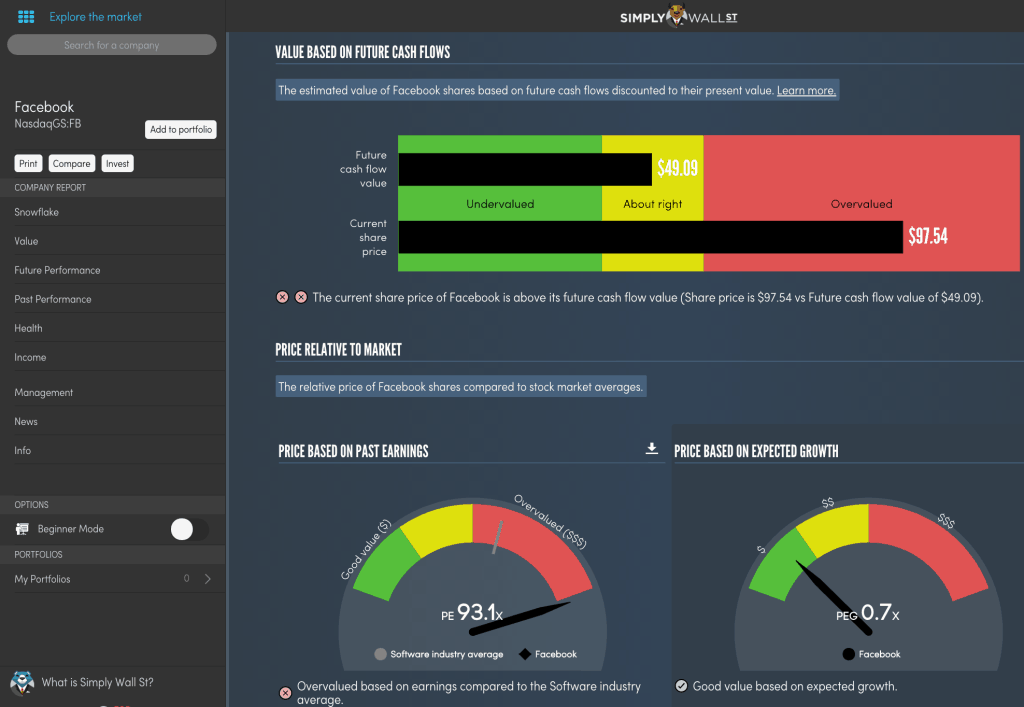
According to the data on Simply Wall St. based on the future expected cash flow of Facebook, it should realistically be priced at $49.09, when it is actually currently at $97.54.
Another cool feature is that the platform goes beyond just presenting the raw data and actually helps you interpret it – notice below how, despite the fact “price based on past earnings” makes Facebook “overvalued”, it is in fact believed to be a “good value” based on the current “priced based on expected growth”.
To compare, I took a look at data on Facebook’s stock on other websites and couldn’t find as simple yet valuable an analysis of this type of data.
Clearly, Facebook is overvalued based on its future cash flow value (as are most tech stocks these days), but it’s nice to be able to see this visually and I look forward to continuing to monitor this information over time using the platform.
Projected Future Performance
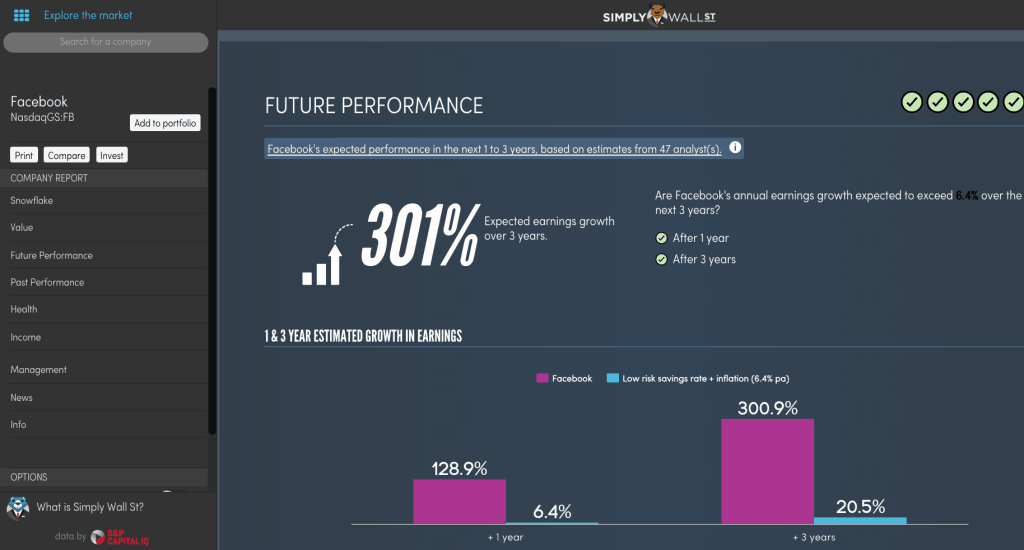
But there is one final feature that I liked and wanted to highlight – the projected future performance of the stock based on an aggregated analysis of stock analyst predictions.
For Facebook specifically, it shows massive future performance potential based on 47 analyst predictions. According to this data, earnings are expected to grow by over 300% over the next 3 years.
This information, based on my assessment of other websites, was an extremely accurate aggregation of Facebook’s expected future performance that I found on other websites.
For most stock investors future performance expectations are essential when analyzing whether or not to buy a stock. I recommend you check out the stocks you are looking at on Simply Wall St. before buying or selling them.
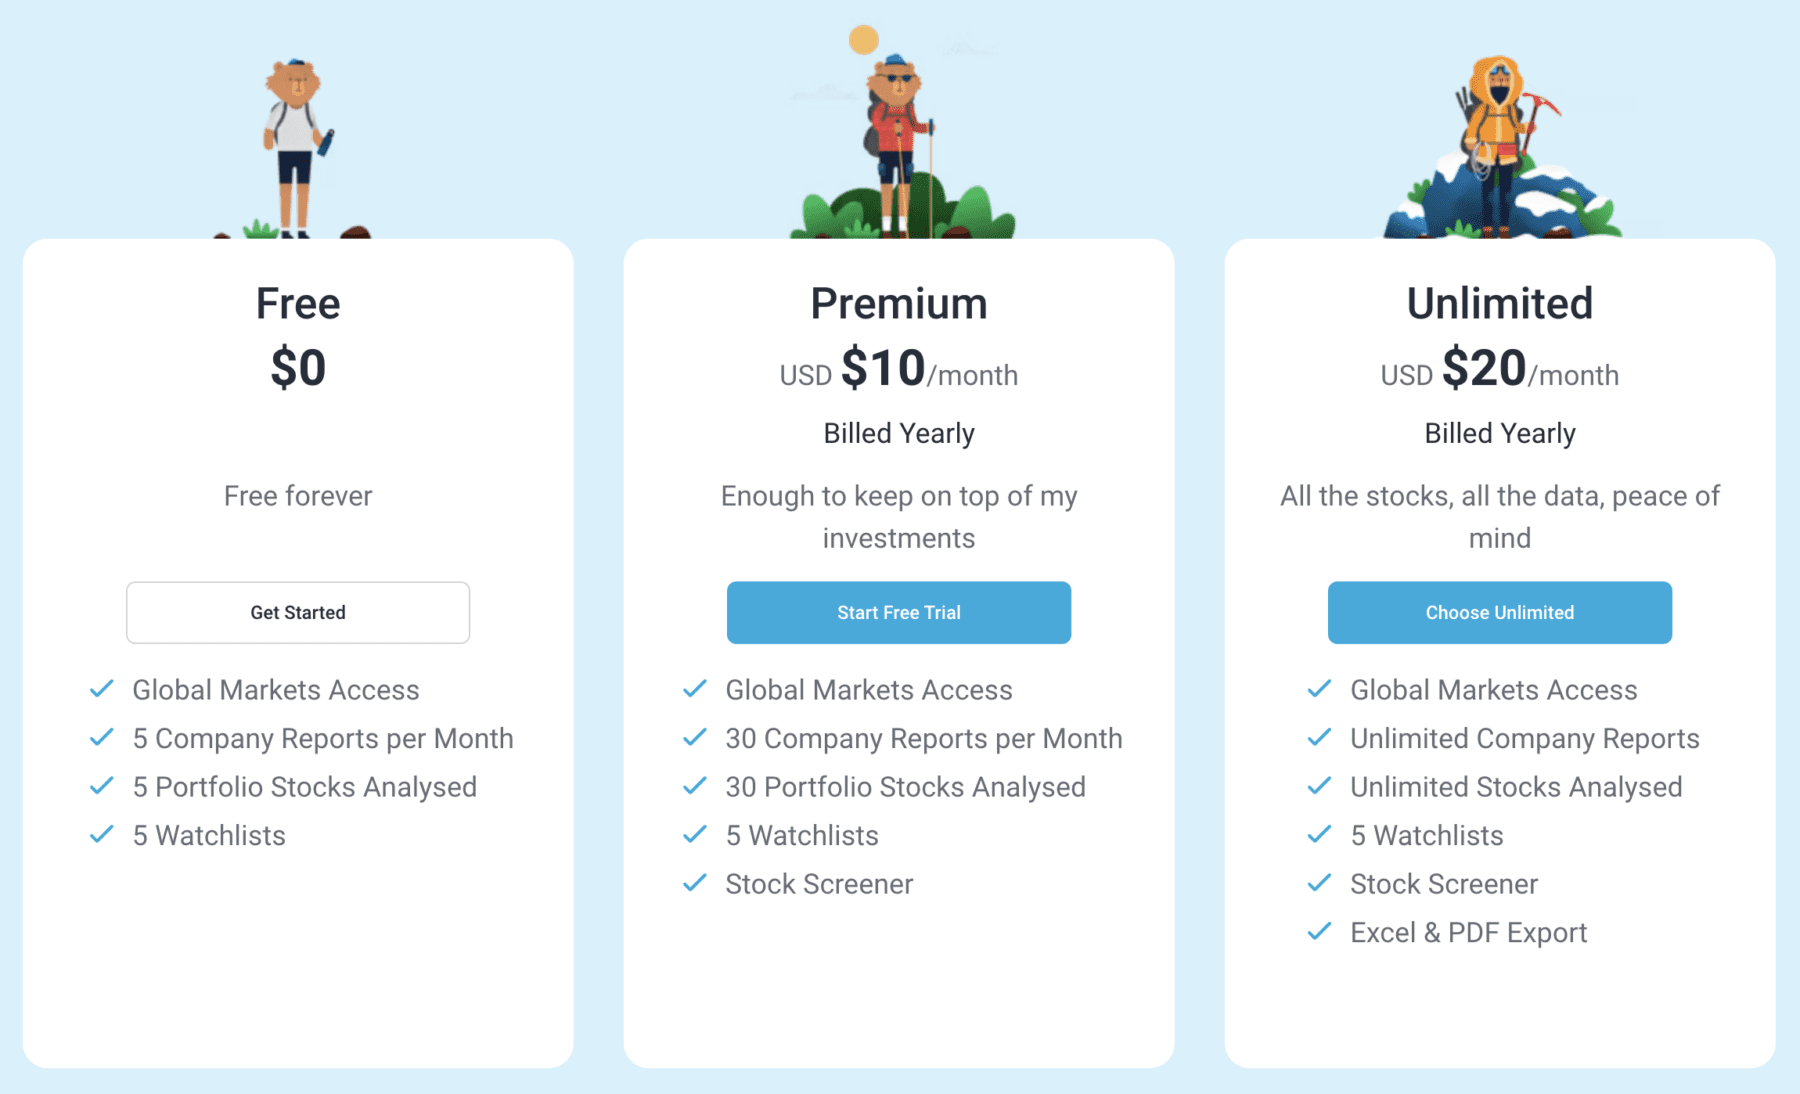
Cost
Simply Wall St. has a couple of different plan options you can choose from:
- Free
- Premium: $10/month
- Unlimited: $20/month
Getting Started
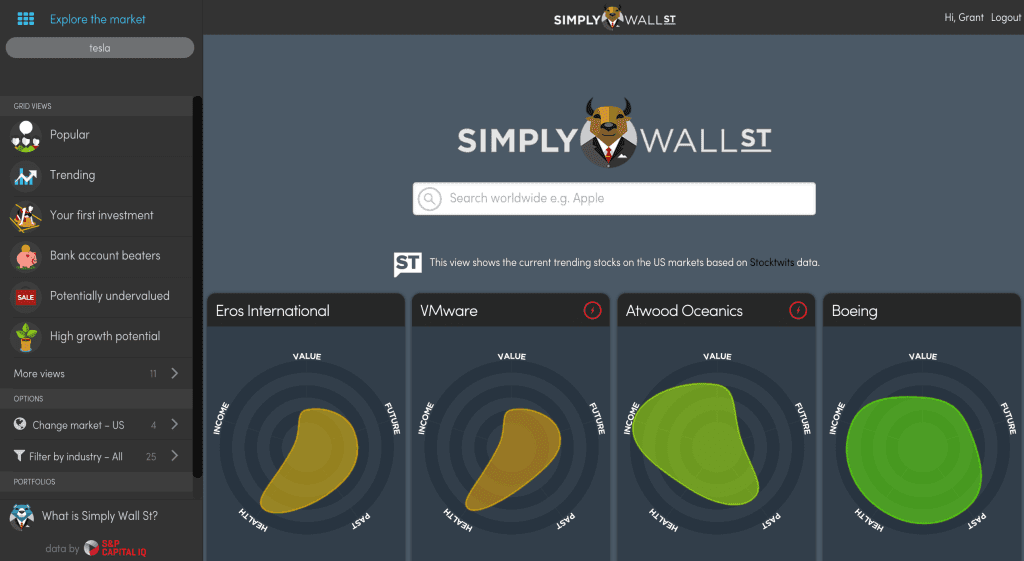
To use the platform you need to set up a free account – just click here to begin.
The sign-up process is super simple and you can get started in less than 10 seconds. From your first log in the platform is easy to use on any device. I logged in both from my computer and my iPad and has great experiences with both of them. Below is a look at the current user dashboard.
Pros and Cons
Pros:
- Reasonably Priced
- Great Reputation
- Visuals Make It Easy to Comprehend
- Comprehensive Stock Analysis Reports
Cons:
- Free Version is Lacking
- Not Flexible for Adding Additional Data
Alternative to Simply Wall St.
Is Simply Wall St. Best for You?
Simply Wall St. is clearly the best stock data visualization website I have ever seen and I have already spent many hours analyzing stocks that I have previously purchased and a few that I am looking into buying in the near future.
As I mentioned before this platform is an exceptional way to browse stocks and I personally recommend it to any investor who wants to experience a new way to look at stock data.
Simply Wall St. is particularly helpful for new investors with its “beginner mode” and the ability to build and track your own portfolio. I hope you enjoy Simply Wall St. as much as I do.


Read 12 comments or add your own
Read Comments