A lot goes into managing your money, and there’s no better way to level up your financial plan than having all the information in front of you.
In this post, we’ve pulled dozens of personal finance stats to help you check the pulse on the nation’s finances and your own.
Whether you’re curious about how your money management stacks up to national trends or you’re just looking for some fascinating facts, take a deep dive into the numbers with our roundup of 2024 personal finance stats.
General Personal Finance Statistics
The average household bank account in the US has $62,500.
According to the most recent Survey of Consumer Finances in 2022, the mean bank account balance for American households is $62,500. That’s a 19% increase from the 2019 survey.
The median net worth of American households is $192,900.
Between the 2019 and 2022 studies, the real median net worth of Americans increased 32% to $192,900. The average net worth is significantly higher, at $1,063,700, because of outlying multi-millionaires and billionaires.
53% of American adults and their partners earned non-labor income in 2022.
The Federal Reserve reports that more than half of US adults and their partners received non-labor income in 2022, which can come from sources like investments, interest, social security, and unemployment. Meanwhile, 66% of adults and their partners received income from work they completed.
The number of people considered to be financially healthy declined by 3% between 2021 and 2022.
In the 2022 Financial Health Network’s annual Financial Health Pulse Report, the percentage of Americans considered financially healthy decreased by 3%, from 34% in 2021 to 31% in 2022. In the 2023 study, there were no significant changes in the percentage of financially healthy Americans.
In 2023, the percentage of financially vulnerable Americans increased to pre-pandemic levels.
The most recent Financial Health Pulse Report did see an increase in the percentage of financially vulnerable Americans, which increased from 15% to 17%. The percentage of people considered to be financially coping decreased by 1%.
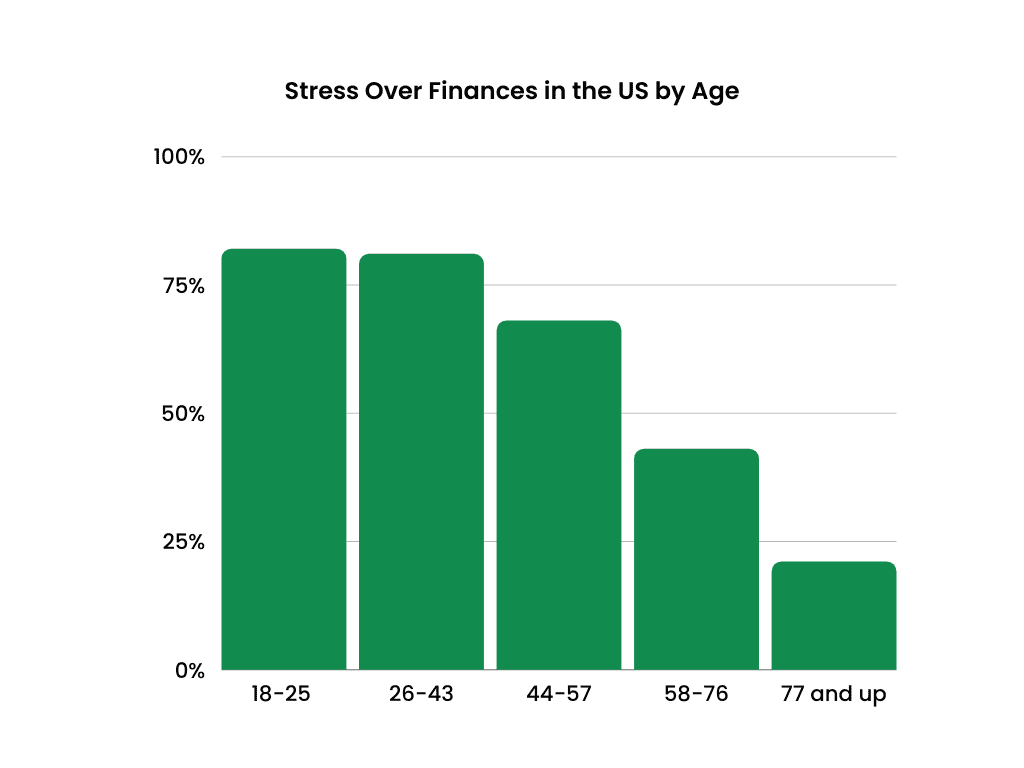
More than half of adults in America cite money as a significant source of stress.
According to the 2023 Stress in America study published by the American Psychological Association, 63% of Americans say that money is a significant source of stress, down 2% from the 2022 survey.
Millennials and Gen Z were the most notably affected by financial anxiety. The APA survey found that 82% of Americans ages 18-25, followed by 81% of 26-43-year-olds, considered money to be a significant stress point in their lives.
Financial Literacy Statistics
The majority of Americans believe financial education classes should be mandatory.
PR Newswire reports that 86% of Americans believe personal finance classes should be required in K-12 schools. But that’s pretty far from the reality of most schools across the US.
High schoolers are required to take a personal finance course in 30 states.
According to a 2023 update to the Council for Economic Education’s Survey of the States, 30 states now require students to take a personal finance course to graduate high school. That’s an improvement from 2020 when only 21 states required a financial literacy course.
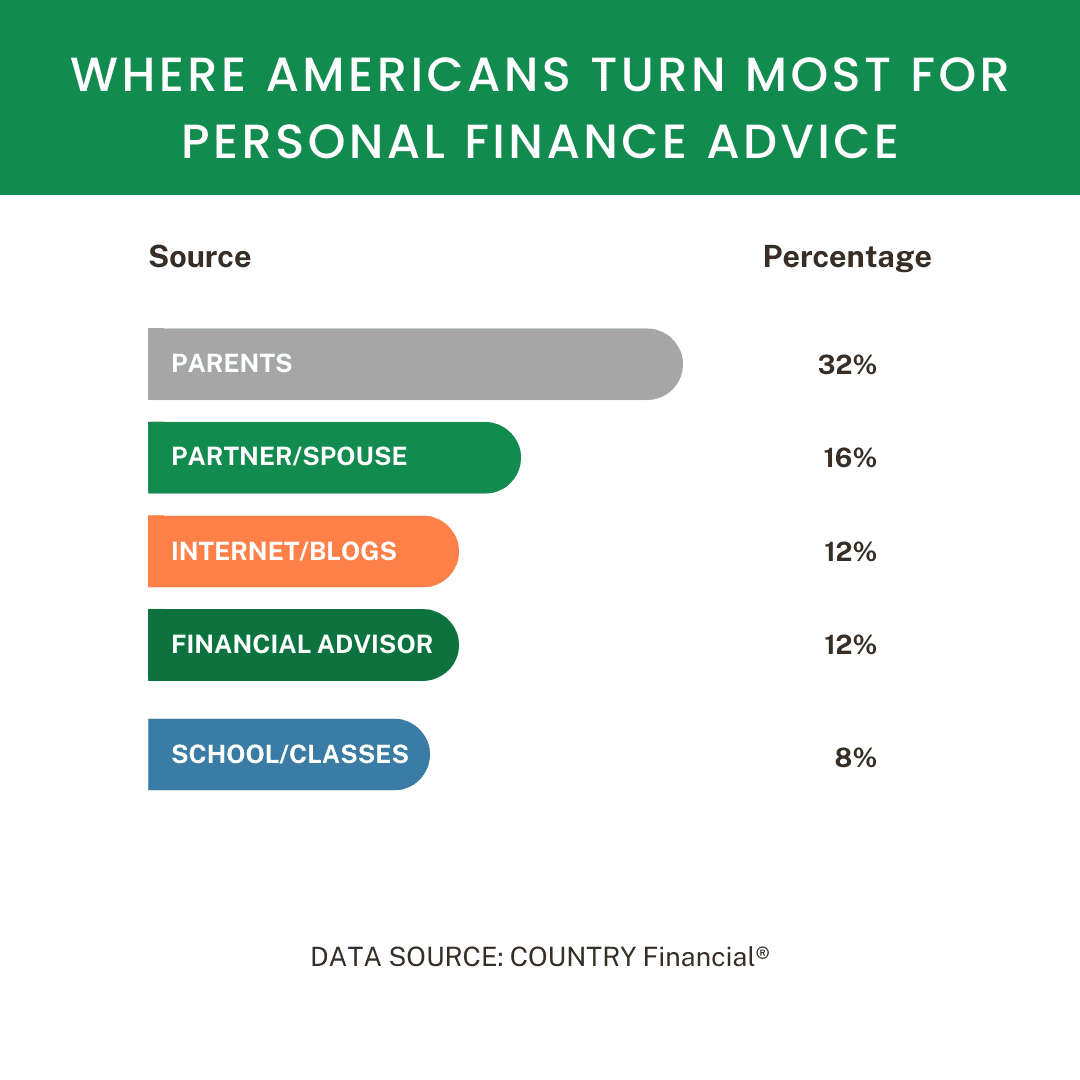
Most Americans turn to their parents before other sources to learn about personal finance.
When it comes to seeking advice on money management, these are the first places people turn, based on Country Financial’s survey:
However, 46% of parents would give themselves a C or lower in financial literacy.
While more survey respondents said they’re likely to turn to their parents for financial advice than other sources, nearly half of parents with children under 21 rated their own financial literacy at a grade of C or lower.
Here’s the percentage of parents who feel confident managing different areas of their personal finances:
- Planning for retirement: 61%
- Taking out/repaying student loans: 55%
- Managing a 401k: 53%
- Investing: 33%
Spending, Saving, and Budgeting Statistics
Nearly 2/3 of American adults live paycheck to paycheck.
According to the Paycheck to Paycheck report from PYMNTS and LendingClub, 61% of adult consumers in the US lived paycheck to paycheck in 2022, a 9% increase from 2021.
Over 1/3 of high-income earners live paycheck to paycheck.
This trend applies to individuals with a higher annual income as well. 36% of people who earn $250,000 or more reported they still live paycheck to paycheck.
22% of people who live paycheck to paycheck struggle to pay their monthly bills.
While the majority of people who live paycheck to paycheck are able to pay their bills with little difficulty, nearly a quarter say they live paycheck to paycheck and find it difficult to make all their monthly payments.
Half of Americans are saving to prepare for a potential recession.
According to Northwestern Mutual’s 2023 Planning and Progress Study, 67% of US adults fear a recession is coming and are modifying their spending and saving habits as a result. To prepare, 64% are cutting costs, 50% are bulking up their savings, and 38% are postponing big purchases.
The average amount of personal savings in 2023 was $65,000.
The survey also found that the average personal savings level in 2023 is $65,000, up 5% from 2022.
Over 2/3 of Americans say they could pay an unexpected $400 bill with cash or its equivalent.
According to 2023 data from the Federal Reserve, 63% of adults say they’d have the means to pay a $400 expense out of the blue with cash, a debit card, a credit card to be paid off at the end of the month, an emergency fund, or a general savings account. 16% said they would put the expense on a credit card to pay off over time, while 13% say they couldn’t cover an unexpected $400 expense at all.
73% of American adults say they’re at least doing okay financially.
The Federal Reserve’s Economic Wellbeing of US Households Study also found that nearly 3/4 of Americans considered themselves to be doing okay or living comfortably in 2022 in terms of finances. 19% said they were just getting by, while 8% said they were having a hard time getting by. Minorities, single individuals, people with limited education and income, and those who suffered from job losses reported lower levels of financial well-being overall.
Around 1/3 of the average American’s budget goes towards paying their rent or mortgage.
According to data from the Bureau of Labor Statistics, the biggest chunk of Americans’ paychecks goes to their mortgage or rent.
Here’s a breakdown of the top 5 spending categories for the average American household, based on the 2022 Consumer Expenditures Survey:
- Housing: 33.3%
- Transportation: 16.8%
- Food: 12.8%
- Insurance/pensions: 12%
- Healthcare: 8%
Credit Statistics
The average credit score in the US in 2023 was at a record high of 715.
According to Experian, the average FICO credit score in 2021 and 2022 was 714, up four percentage points from 2020. It increased another point last year. The average credit score increased in all age groups in 2021, remained mostly unchanged in 2022, and increased for most age groups in 2023.
Americans carry an average of around four credit cards.
According to data from Experian, the average American carries 3.84 credit card accounts.
Credit card debt hit a high of $1.08 trillion dollars in the US in 2023.
According to the New York Fed, credit card debt continued to increase in 2023, with outstanding credit card balances reaching a total of $1.08 trillion dollars.
Gen X has the highest amount of credit card debt, and Gen Z has the lowest.
According to Experian’s 2023 Consumer Debt Study, Generation X carries the highest credit card balances, averaging $8,870. Generation Z falls on the opposite end of the spectrum, which can be attributed to their young credit history and limited access to credit.
4 out of 5 adults in the US carried a credit card in 2022, but there are some disparities.
The Fed reported that 82% of Americans had at least one credit card in 2022, with some races being more likely to have a card than others.
Here’s a breakdown of the percentage of people who had credit cards in 2022 by race:
- Asian: 92%
- White: 87%
- Hispanic: 73%
- Black: 71%
Loan Statistics
National student loan debt currently totals more than $1.6 trillion.
According to the White House, the total student loan debt total currently sits around $1.6 trillion, with over 45 million borrowers.
Attendees of private for-profit colleges and universities are most likely to be behind on their student loan payments.
According to the Federal Reserve Bank, in 2022, around 30% of borrowers who attended for-profit institutions were behind on student loan payments, compared to 11 percent of public institutions attendees and 7 percent who attended private nonprofit institutions.
Delinquency rates on student loans are lower for individuals with higher degrees.
The Fed’s Economic Wellbeing Study also found that students with no degree or lower-level degrees struggled the most with student loan repayments.
Here’s the breakdown:
| Degree Level | % of Individuals with Delinquent Student Loans |
| Less than an Associate’s degree | 28% |
| Associate’s degree | 19% |
| Bachelor’s degree | 7% |
| Graduate degree | 6% |
While individuals with higher-level degrees likely have more debt, they often have more earning power, making it easier for them to pay off their student loans.
The average monthly mortgage payment in the US is $1,100.
Mortgage debt is one of the other most significant sources of consumer debt among Americans. The Census Bureau’s most recent American Housing Survey conducted in 2021 puts the average monthly mortgage payment at $1,100.
In 2023, the nationwide mortgage balance was $12.14 trillion.
According to the Fed, the total mortgage balance from all consumer credit reports in the country was $12.14 trillion in Q3 of 2023.
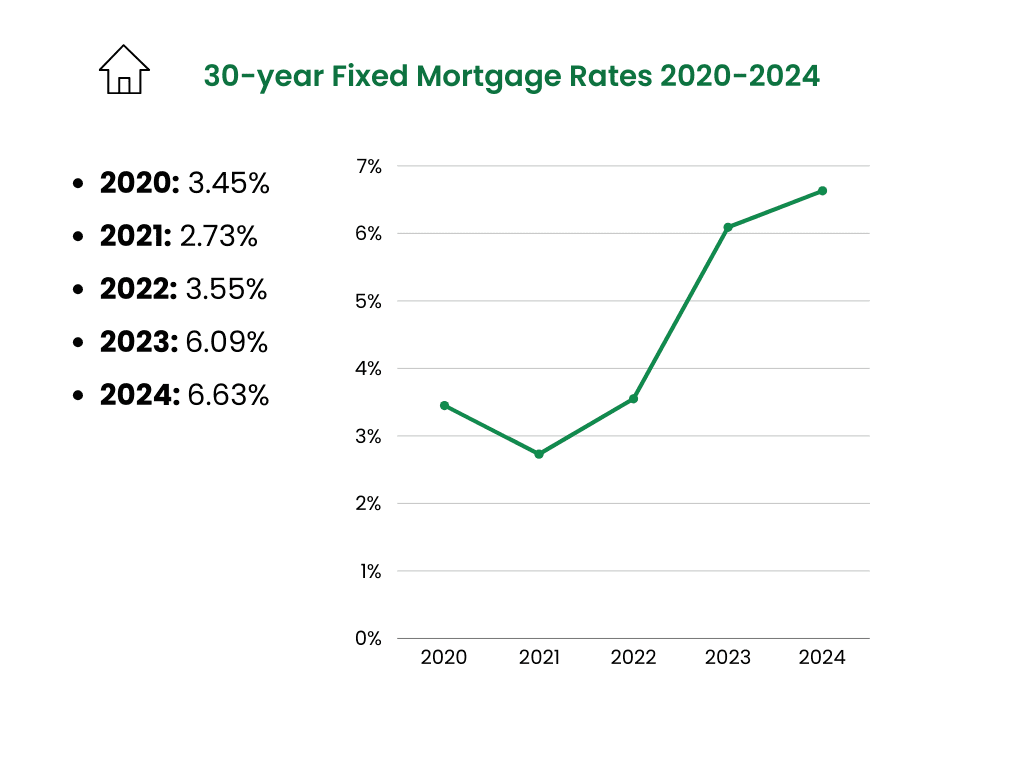
Mortgage rates hit an all-time low in 2021 and increased sharply in 2023.
Data from Freddie Mac reveals that mortgage interest rates were at an all-time historic low in 2021, at 2.96%. In September of 2023, the annual average mortgage rate was 7.12%. The average rate peaked in October, at 7.79%, falling to 6.63% in February of 2024.
Here’s a look at the average 30-year mortgage rates in February over the last five years:
Retirement Statistics
In 2022, 27% of American adults considered themselves to be retirees.
27% of adults nationwide considered themselves retired in the 2022 Financial Wellbeing Survey. 4% of retired adults said they were still working in some capacity.
51% of people chose to retire so they could do other things, like spending time with loved ones.
Another 47% said their decision to retire was just based on them reaching retirement age. 30% listed health problems as a factor that impacted their decision to retire.
36% of adults say they’re on track for retirement.
The Financial Wellbeing Survey also polled working adults about retirement, finding that just under one-third of adults feel confident that their retirement goals are on track. What’s worse, 28% of adults who aren’t retired yet said they had zero retirement savings.
Most people start saving for retirement because they reach a certain age or they’re offered an employer match.
In a Statista survey of 1,000 retirees, these were the top 10 reasons people started saving for retirement:
| Reasons to Start Saving | % of Retirees |
| Reached a certain age | 29% |
| Offered an employer match | 24% |
| Offered an employer-sponsored plan | 22% |
| No particular reason | 17% |
| Automatic enrollment in a workplace plan | 16% |
| Started a family | 15% |
| Started first job | 12% |
| Purchased first home | 9% |
| Earned a promotion or raise | 9% |
| Moved to a new job | 9% |
Americans plan to retire at the average age of 65 and want $1.27 million to live comfortably.
On average, respondents to Northwestern Mutual’s 2023 Planning and Prgoress Studey said they plan to retire at 65. Most adults said they believe they will need $1.27 million in savings, up from $1.25 million the previous year.
The average retirement savings amount in 2023 for US adults is $89,300.
Northwestern Mutual puts the average retirement savings amount at $89,300, which is a 3% increase from 2022.
Bottom Line
If you’re feeling overwhelmed by your financial situation and the economy, you aren’t alone. But as the data here shows, you can improve your finances with some time, effort, and determination.
Sources:
Survey of the States, Council for Economic Education
Parents and Financial Guidance Survey, Country Financial
Survey of Consumer Finances, Federal Reserve
Financial Health Pulse 2023 US Trends Report, Financial Health Network 2023
Planning and Progress Study, Northwestern Mutual
Economic Wellbeing of US Households, Federal Reserve
2022 Consumer Expenditures Survey, Bureau of Labor Statistics
Average Credit Score in the US, Experian
Household Debt and Credit Report, New York Fed
2023 Consumer Debt Study, Experian
Student Loan Fact Sheet, The White House
American Housing Survey, United States Census Bureau
Household Debt and Credit Report, New York Fed
30-year Fixed Rate Mortgages Since 1971, Freddie Mac
Reasons to Save for Retirement, Statista
Stress in America 2023, American Psychological Association


No comments yet. Add your own